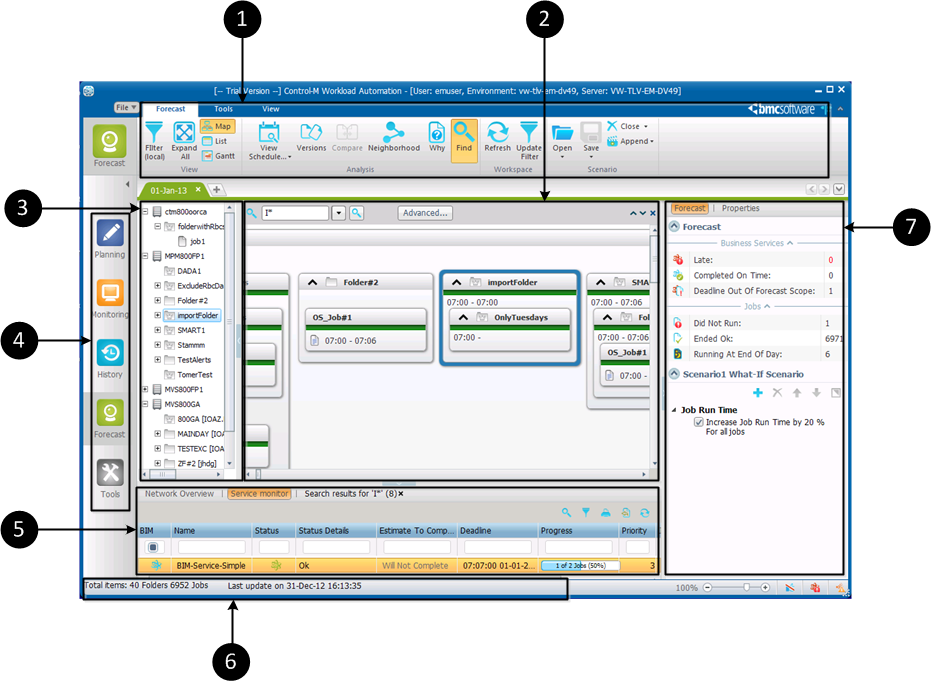
The following figure shows a Forecast Workspace in the Forecast domain:
The following table describes the areas in the Forecast domain in Control-M :
Callout |
Area |
Description |
|---|---|---|
1 |
Ribbon |
Displays menus that enable you work in the domain, find the tools related to the domain, customize the view, and analyze your flow |
2 |
Main pane |
Displays the jobs and folders in the domain. You can display the area as a Map or List or Gantt chart |
3 |
Tree pane |
Lists the entities according to the defined hierarchy in the View tab |
4 |
Domain selector |
Lists the various functional areas in the application where you can plan, monitor, view history, forecast, use tools, and view Newsfeed |
5 |
Results pane |
Displays results such as results of Find and Validation report, Show Changes results, and displays the Network Overview. The thumbnail version of the flow diagram currently displayed in the Main pane with the following color indications when the Main pane is set to Map:
|
6 |
Status bar |
Displays information about the flow diagram |
7 |
Properties pane |
Displays the properties of the selected entity |
Parent Topic |